Matthew Riley
mgriley97@gmail.com
Diva
Suppose you wrote some functions that gather data (like query your analytics database, consult some endpoints, etc.) and return analytics objects like numpy arrays, pandas DataFrames, or matplotlib figures. Diva allows you to generate a HTML dashboard (served with Flask) to display these objects. Diva dispatches on the return type of your functions to generate the appropriate HTML.
Diva is MIT licensed and available on PyPi. I sadly haven’t had the chance to work on this for some time, but there is extensive documentation for those interested:
Homepage and Docs: http://diva.readthedocs.io/en/latest/index.html
Github: https://github.com/mgriley/diva
PyPi Link: https://pypi.python.org/pypi/diva \
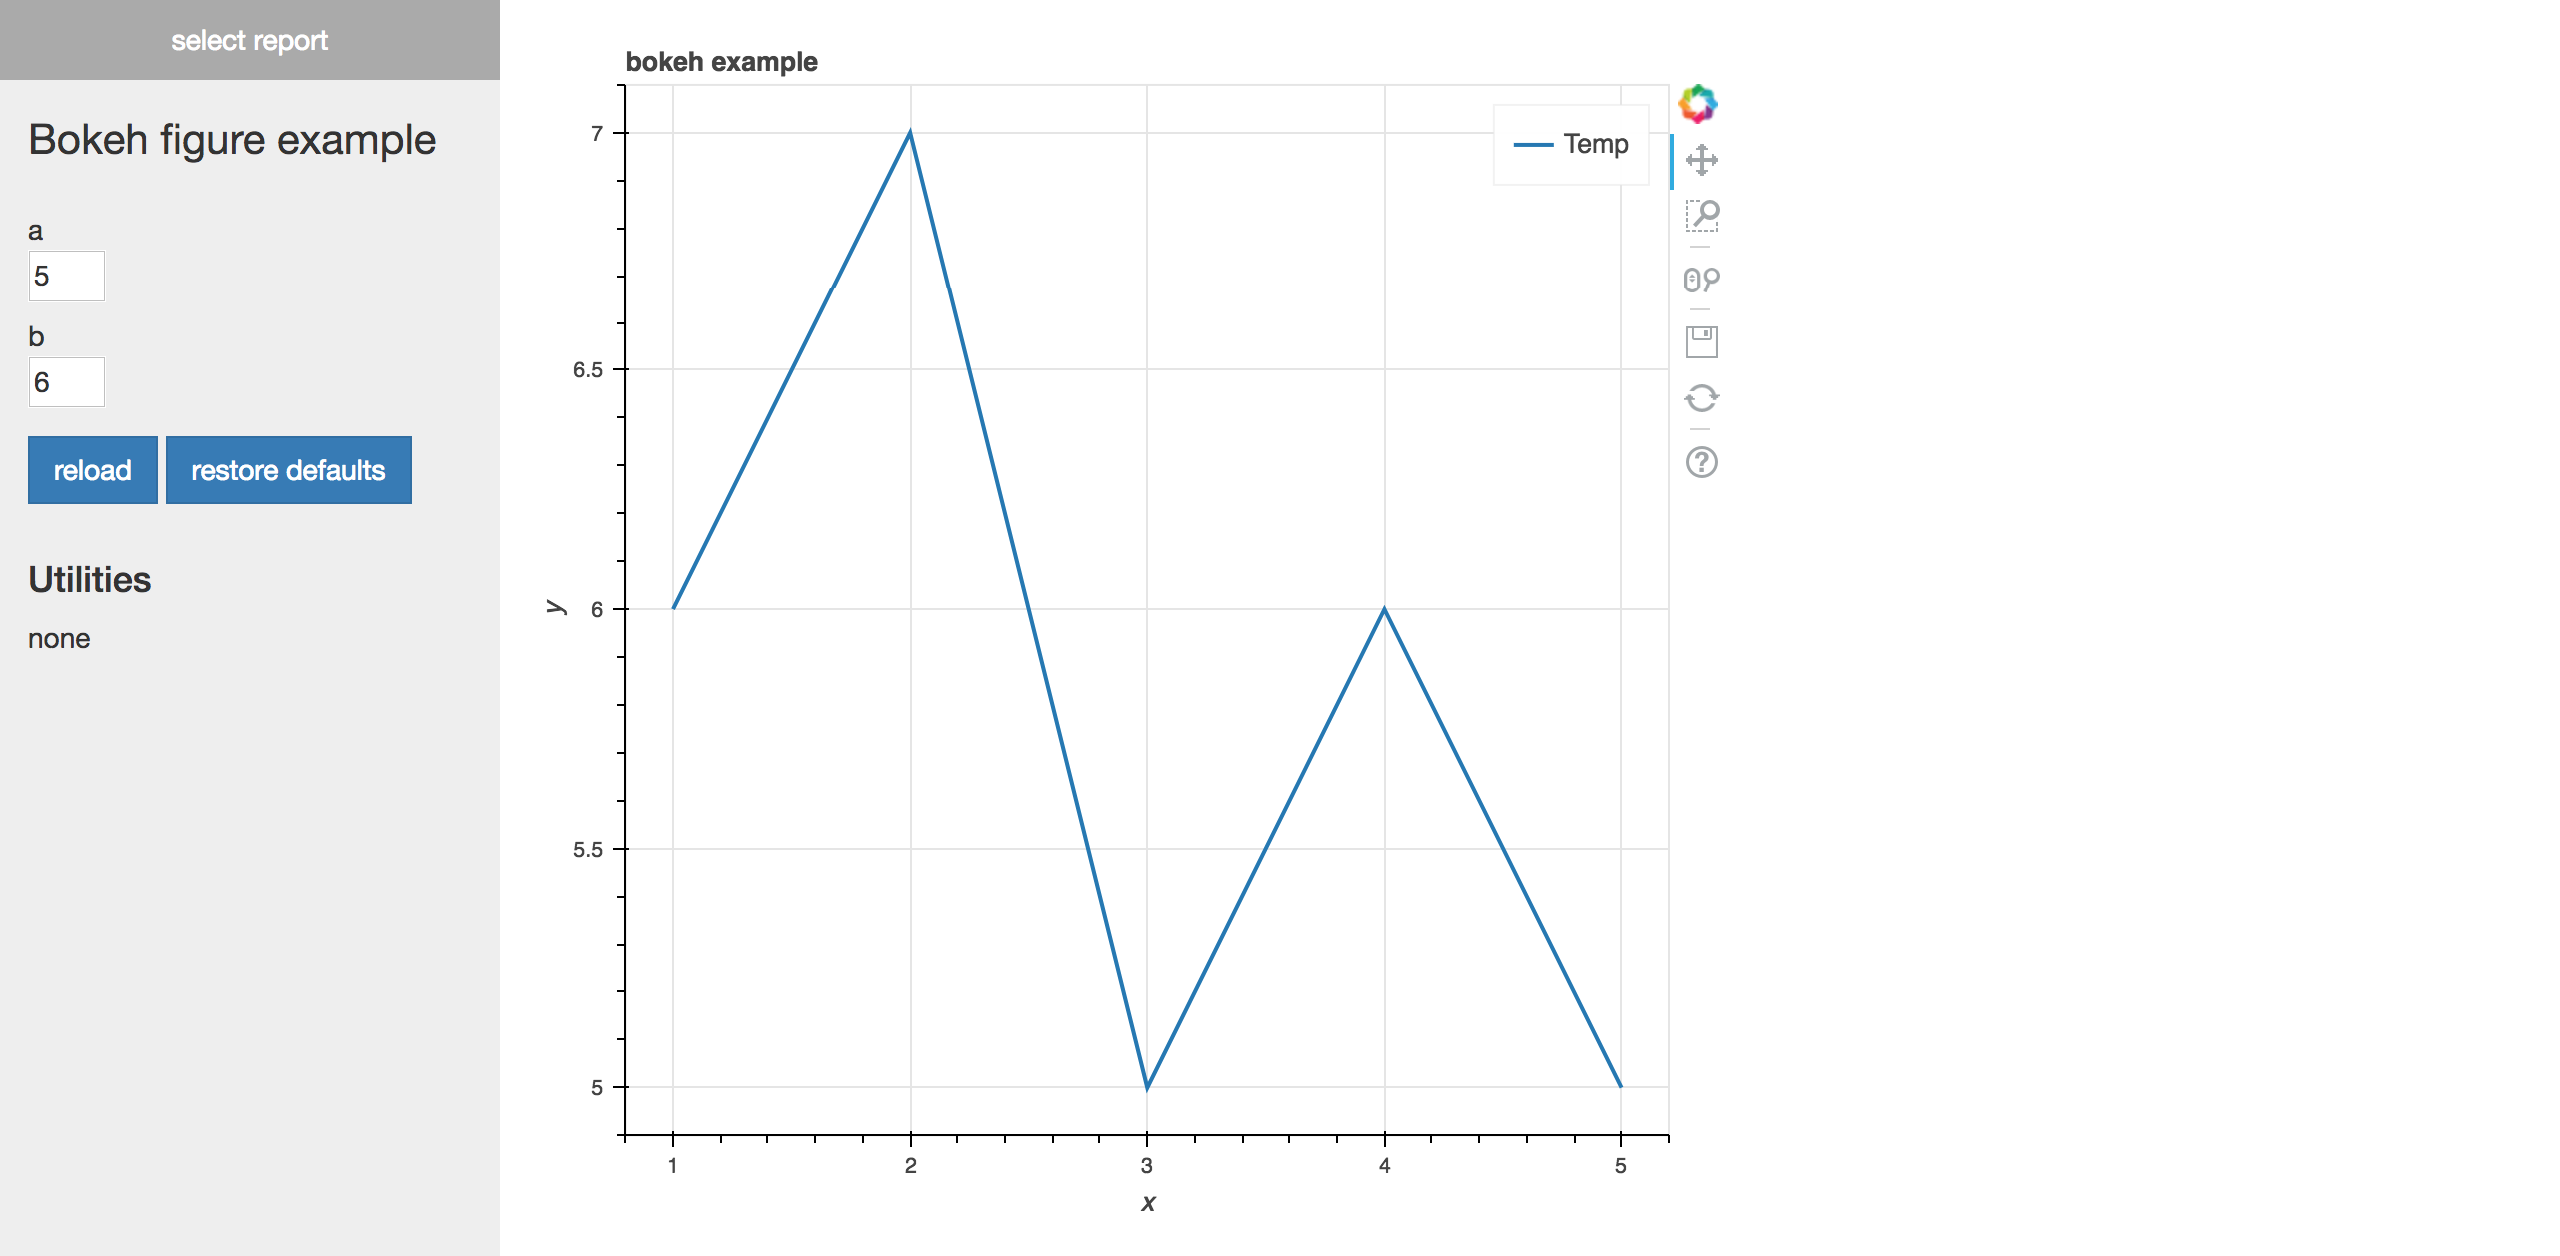
Widgets
Perhaps you have a graph of # of downloads versus time that you’d like to view for a specific time range. Just modify your function so that it takes two arguments: the start and end date. Tell Diva what inputs your function needs (in this case DateTime widgets) and it will generate the required HTML. Here is an example using Float widgets:
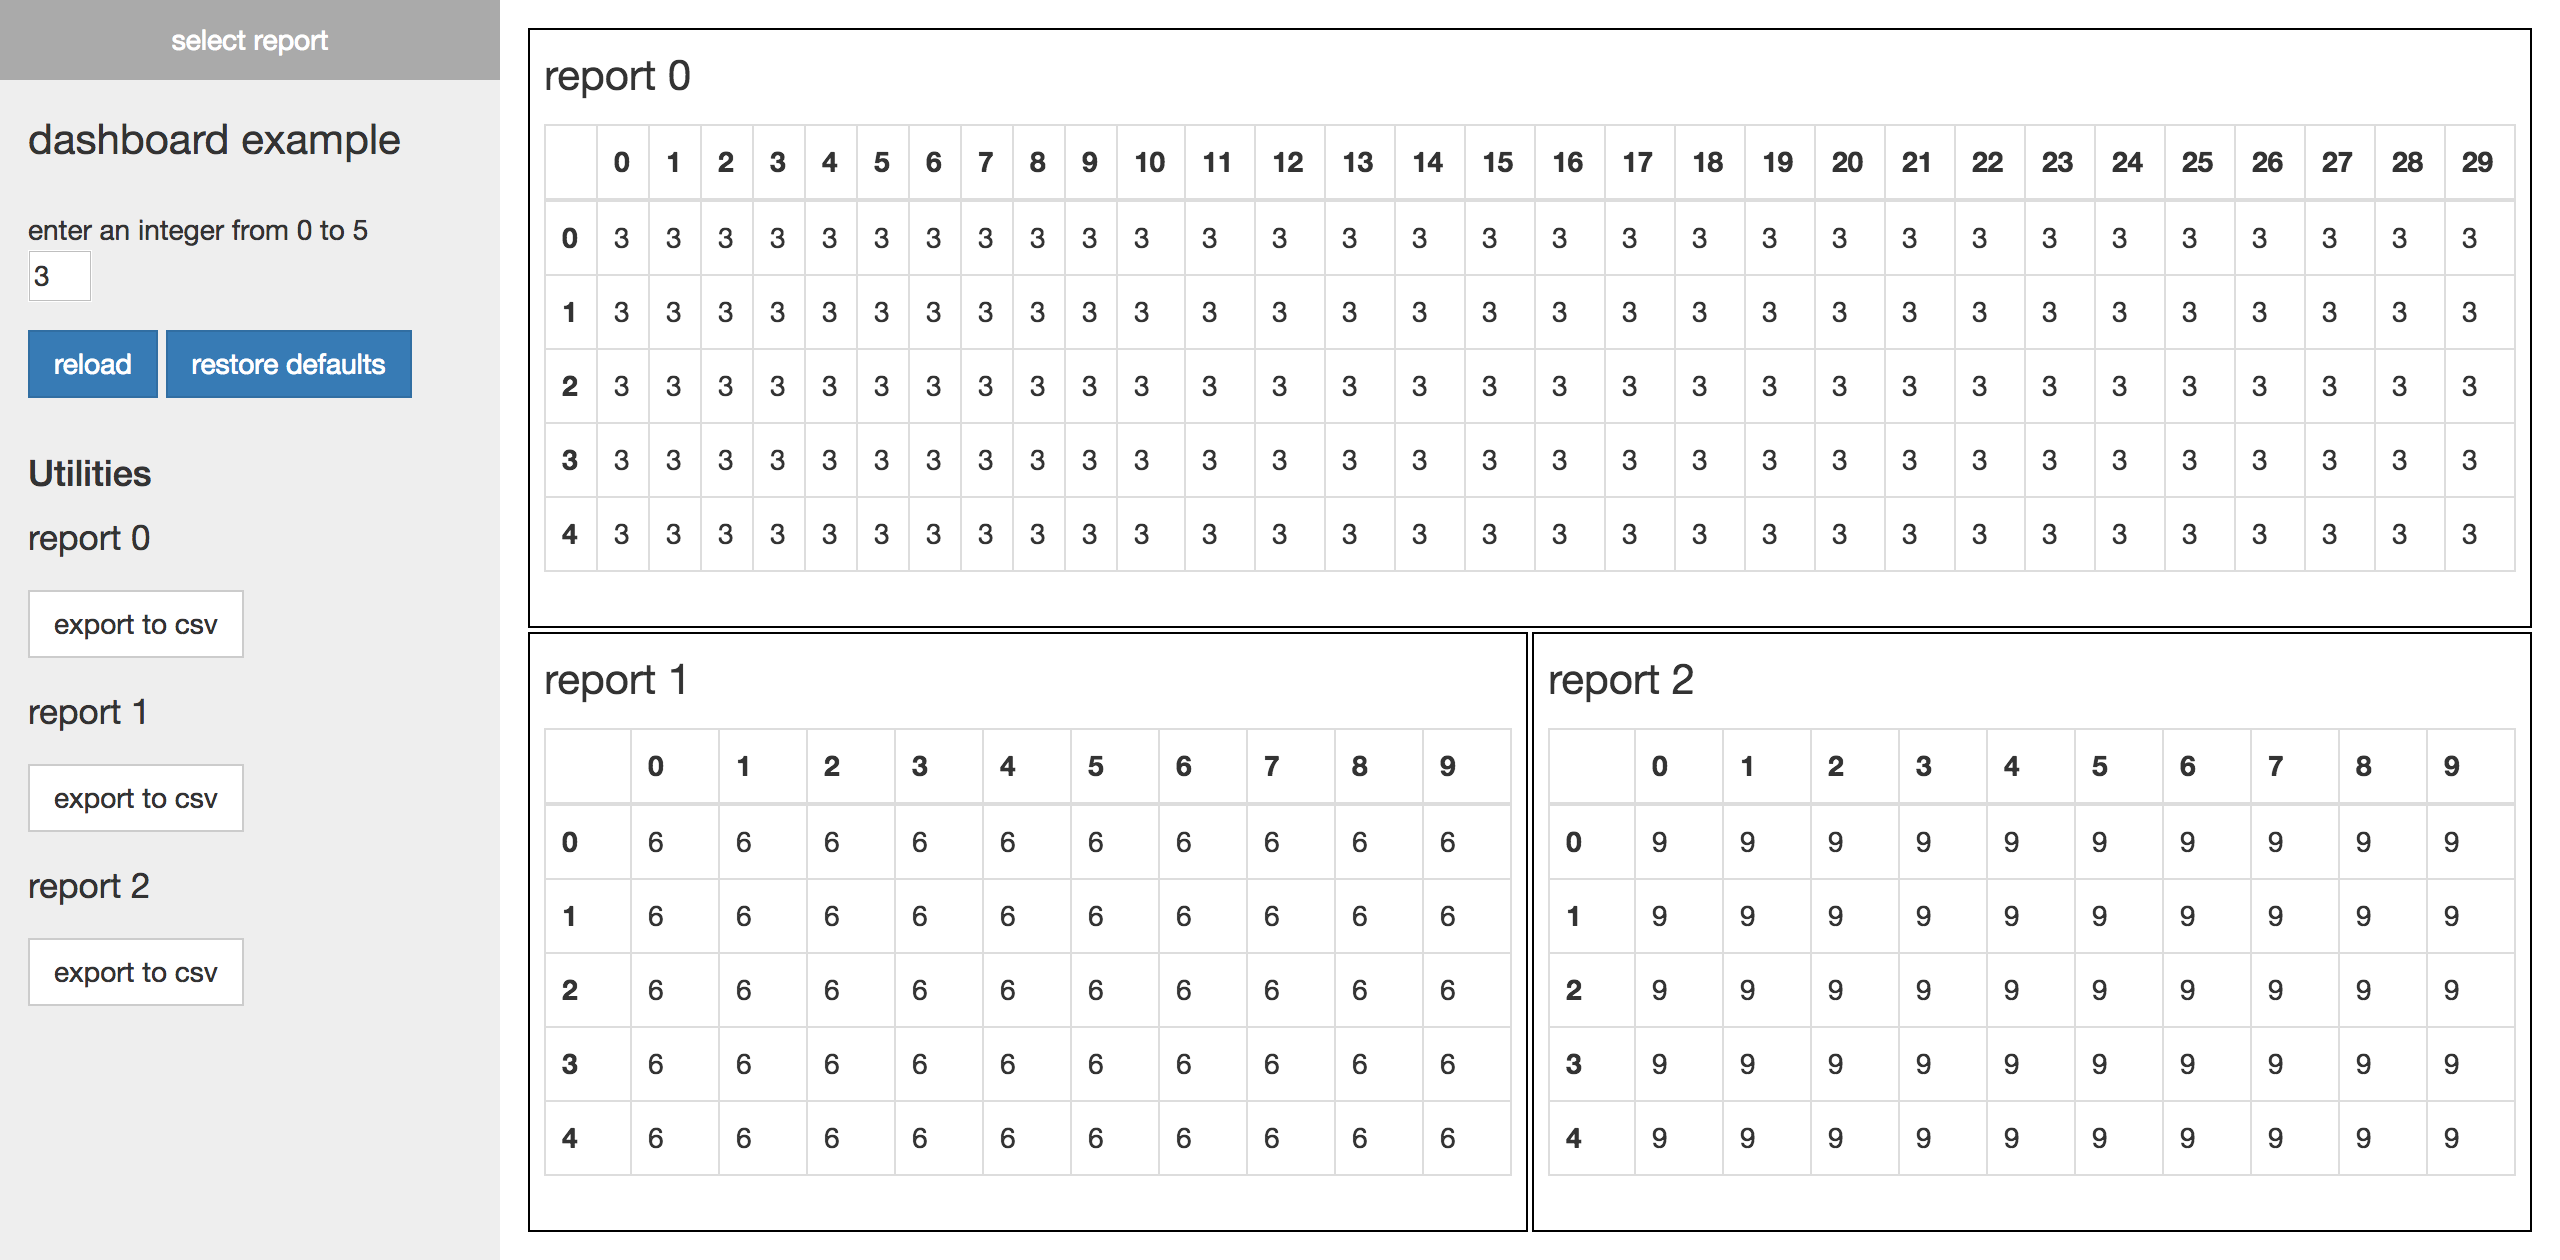
Utilities
Diva also uses the return type to generate a set of relevant utilities. For example, if you return a pandas DataFrame you’ll find a nice button called “export to csv” that converts the DataFrame to a csv file and downloads it. You can add your own utilities, too.
Grids
You often want to arrange your plots and tables in a grid for easy comparison. There is a special Dashboard object that takes a list of objects and a layout specification. It recursively converts the list of objects to HTML and arranges them as specified.